2026 ChemE Compensation Report
If you prefer something you can print out - here is a PDF download of the 2026 Chemical Engineering Compensation Report.
![]()
2026 Chemical Engineering Salary Report (U.S. Compensation Data)
The 2026 Chemical Engineering Salary Report analyzes compensation data from 1,947 U.S. chemical engineers collected between December 2025 and January 2026. The report examines how compensation varies by years of experience, education level, management responsibility, and industry sector.
Our goal is to provide the most transparent dataset available for chemical engineers so professionals can benchmark their pay against peers across the industry.
Key findings include:
Median base salary trends
Compensation differences by experience level
Impact of advanced degrees such as MBA and PhD
Manager vs. individual contributor pay differences
This report is compiled annually by Sun Recruiting, a recruiting firm specializing in engineering and operations roles in the U.S. chemical processing industry.
Survey Methodology:
This chemical engineering salary report was based on 1,947 unique data points all of which were collected via a web form on the Sun Recruiting website from December 1st, 2025 to January 12th, 2026. I used email, LinkedIn posts, posts on the Chemical Engineering and Women-in-Engineering subreddits and word-of-mouth to spread the message that I was looking for data. Respondents answered a series of 43 questions covering topics including base and non-base compensation, work schedules, industry type, degree level, etc. The collected information was analyzed by me and my colleague Ethan and all identifying information was removed prior to analysis. Ethan was invaluable in helping to analyze this data, thanks to his background in actuarial science!
I continued my use of Julius AI this year and I have to say, I was impressed with what it could do last year, but this year I'm blown away. There are some dashboards and charts here that were created using that tool and it's beyond what I thought was possible without having someone who knows how to code websites. Very impressed and I hope that you will find what I've offered here useful.
Previous iterations of the salary report are available – please email me if you’d like a copy of the 2025, 2024, or 2023 reports.
The Only Sales Pitch You'll Get From Me:
I enjoy putting this resource together every year and am gratified to know it is helping people make a difference for themselves, while also bringing much-needed compensation transparency to the industry. All I ask for in return is your consideration in using my firm to help fill open roles, or if you find yourself in a job search, to consider partnering with us in that effort.
Our firm specializes in placing engineering and operations professionals throughout the United States within the chemical processing industry, from startups to Fortune 500s. In the past 4 years alone, about 3,800 different chemical engineers have responded to my surveys which is an indication of how far and wide my reach is in this industry. Let me bring my expertise and reach to bear on your open role, or on your job search. Being successful in my 'day-job' is what allows me to continue putting this together.
**How to Use This Data (Please Read):**
Many of the data points in this survey are MEDIAN data points, meaning that 50% of the responses were higher and 50% were lower. I’ve also included, where appropriate, other percentiles, doing my best to capture the span of the data in the main part of the bell curve (10th to 90th percentile). Having said that, I encourage people not to get lost in the weeds with something like this. This data, while specific, isn’t specific to each individual situation. This data should give someone an approximation of where they stand in relation to their peers. What I envision is that the various data points would be used together – for example, if you are 18 years into your career, you live in the Midwest, you are a manager, you have an MBA and you work in the Industrial Gases industry, use the data here as it relates to all five of those categories to determine general comp targets. If you have any questions, please reach out to me via email or LinkedIn and we can talk it over.
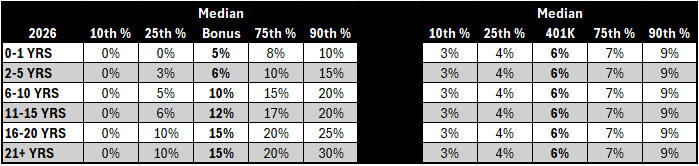
New this year is a "PTC" figure on some of the comparison tables. This is "median potential total comp". Potential total comp is figured by adding the Median Total Comp + Median Bonus Target + Median 401K match. I say "potential" because bonus is never a sure thing. I foresee one of the questions that this analysis will raise, and so right under the table for the 'years of experience' comparison, we've added a small table showing the 10th, 25th, 75th, and 90th percentiles for Bonus and 401K match. This will allow you to make your own calculation based on the specifics of your situation. For example, your base salary might be at the 25th percentile, but your Bonus and 401K match are at the 75th percentile. If you add those elements together, you'll see where you land relative to the Median PTC.
Glossary: N = Number of Respondents, M/F = Male/Female, IC = Individual Contributor, Mgr = Manager, PTC = Potential Total Comp, Avg YOE = Average Years of Experience in a given dataset, WFH = Work From Home, Flexible? = Flex Schedule
The Data
If you haven't read previous versions of my compensation report, one of the fundamental premises of the report is that total years of experience (post-college) is the #1 predictor for base salary. When I first started putting these reports together, I was operating off of that assumption based on anecdote alone, but last year, I put this question to AI and this is what it said,
"The most significant predictor of an individual’s overall years of experience is their current base salary (and vice versa), followed closely by whether they hold an MBA or EMBA degree. This suggests that more years of experience and advanced business education levels are strongly associated with higher salaries. Other notable features include the number of years worked in the current role and various certifications like Six-Sigma and Project Management Professional (PMP), which also contribute to explaining the variance in overall experience, albeit to a lesser extent.
An interesting observation is the relatively low importance of demographic factors such as gender and the industry of the current company, which might typically be expected to have a more substantial impact. Additionally, some features like the extent of work travel and certain company benefits (e.g., remote work or hybrid schedules), have zero importance. This could be due to these features having little to no variation in the dataset or not being directly related to the accumulation of work experience."
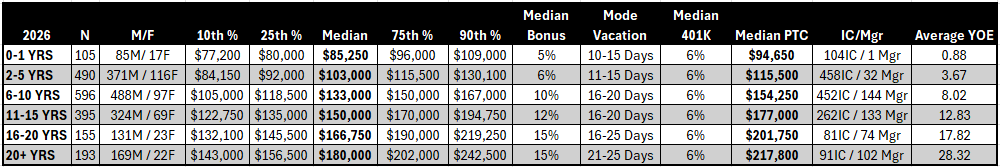
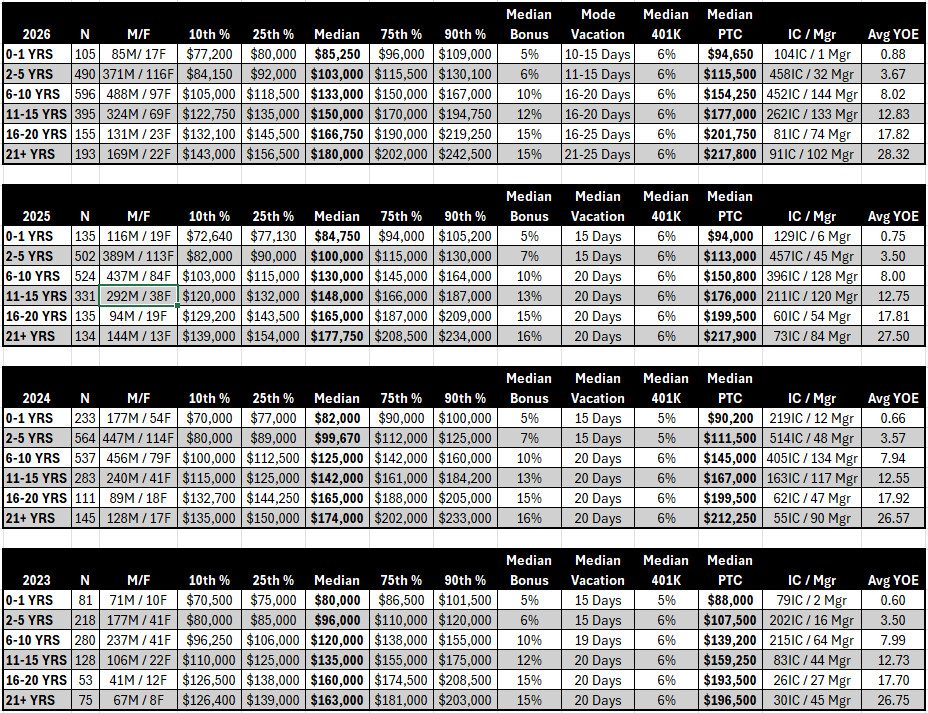
CHEMICAL ENGINEER SALARIES BY YEARS OF EXPERIENCE
Here is this year's data presented in graph form, and I've included the data table below that as well, with some additional information included there. As I mentioned in my opening comments, we have also provided a table showing the 10th, 25th, 75th and 90th percentiles for Bonus and 401K match which should allow for some customization on your part. The example I used above was: if your base salary is in the 25th percentile, but your bonus and 401K match are at the 75th percentile, you could add those elements together and then that should give you a good idea of where you fall relative to Median PTC.
Commentary:
As always, trend data will be at the end of the report. Base compensation across the datasets, from December 2024 to December 2025, was up 4.7% (overall median for the dataset in December 2024 was $127,059 and the overall median in December 2025 was $133,000). That's a good-but-not-great gain and it aligns with what I was sensing as the year went by. Less hiring demand means less competition for talent, means less quickly rising wages.
Two interesting things. A) This dataset is 'older' (more experienced?) than last year's; I think we have more people at the 20+ years of experience range participating so that could be some of it. One of the questions that comes to mind on the basis of that fact would be, "how much of the year-over-year increase can be attributed to that?" B) This year I added a category, "Potential Total Comp" (PTC). One of the questions I asked in this year's survey was about total comp, but unfortunately, the variety of responses I received indicated that people interpreted that question in all sorts of ways and made an analysis of that data nearly impossible. However, in place of that, I thought a 'potential total comp (PTC)' number would be helpful.
Something new this year - I created a dashboard in Julius AI that allows for some limited manipulation of the data for different views. You can find that here. A couple of caveats - I could not get Julius to clean the data in the same way that I do, which created some discrepancies between the numbers I present here and the numbers it presents. If there are differences, that's why. Here is a link to the dashboard.
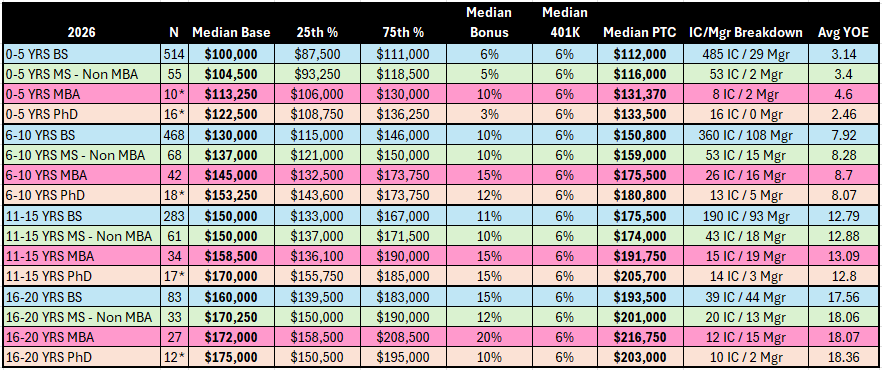
CHEMICAL ENGINEER SALARIES BY LEVEL OF EDUCATION
Last year, I mistakenly thought that having an MBA vs. a technical Master's Degree would make no difference and then the data proved me wrong. This year I added the PTC (Potential Total Comp) figure in at the Median and you can see for yourself what kind of differences there are.
Commentary:
The changes from year to year in this section have been pretty predictable and that pattern follows for this year as well. Last year I pointed out that advanced degrees and certifications appear to matter more (compensation-wise) early in your career than they do later in your career and I still believe that to be true. An advanced degree or a particular certification makes more of a difference, monetarily, earlier in your career because it's more of a differentiator earlier in your career. Many times over the years, I've had people ask me, "do you think I should get an MBA/PE/Six-Sigma Cert/etc"? From now on, my advice is going to be, if you're early in your career, it's a differentiator and definitely something you are going to be paid more for, but the further into your career you get, the more your overall body of experience matters. An exception to this, as I understand it now, would be the MBA. I think it's probable that the reason the MBA shows such a premium is that those with an MBA are *typically* (not always) in management/leadership roles and so the premium that is shown on this table might be a result of management vs. individual contributor rather than there being a significant premium for simply having an MBA. That is hard to parse from the dataset itself. There is also the benefit of having a PhD, but a) my sample sizes for ChemE with PhDs is limited at every bracket and b) I think having a PhD essentially counts as having years of experience so again, it's difficult to parse out the actual monetary benefit.
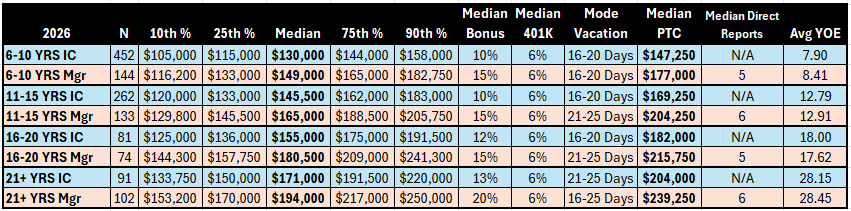
COMPARSION BETWEEN INDIVIDUAL CONTRIBUTORS AND MANAGERS
This data continues to fall in line with previous years' surveys. As a reminder, I start the data table at the 6-10 year mark because prior to that, the vast majority of respondents are individual contributors (this year, 98% of the respondents with less than 6 years of experience were individual contributors).
Commentary:
Whereas certifications and advanced degrees are more valuable earlier in your career, there is a premium, at all levels of experience, for management versus individual contributor. Are there exceptions to this in the data set? Certainly - but by-and-large, if you want to make more money, find yourself a way to get on a management track. I'm looking not only at base salary, but also at the bonus targets, which are higher for managers. I pointed this out last year, but using this year's numbers: if we look at the 6-10 year range, at the median, a manager is making roughly $19,000 more in base salary than an individual contributor, and their bonus target at the median is 5% higher, meaning the manager is bringing home $177,000 compared to the $147,250 of the individual contributor, a difference of $29,750/year ($148,000+ over 5 years). I ran a multvariate model on the data and the biggest structural effect in the data was "the manager premium". The calculation concluded that being on the 'manager track' was associated with roughly a "$20K base salary premium".
Admittedly, I made a mistake with this year's survey - and that had to do with hours worked. I should have just kept it as-is, allowing people to input the number of hours worked per week, but I make it a range (i.e. 40-49, 50-59, etc) which meant that the data became relatively worthless for examination. Won't make that mistake again.
To make up for that, I created a "Career Progression Dashboard", which you can access by clicking here. This is a visualization of the data above but also allows for some manipulation of the data on limited parameters. One necessary caveat, beware of sample sizes as you play with the data, some are too small to be valid for analysis.
CHEMICAL ENGINEER SALARIES BY GEOGRAPHICAL REGION
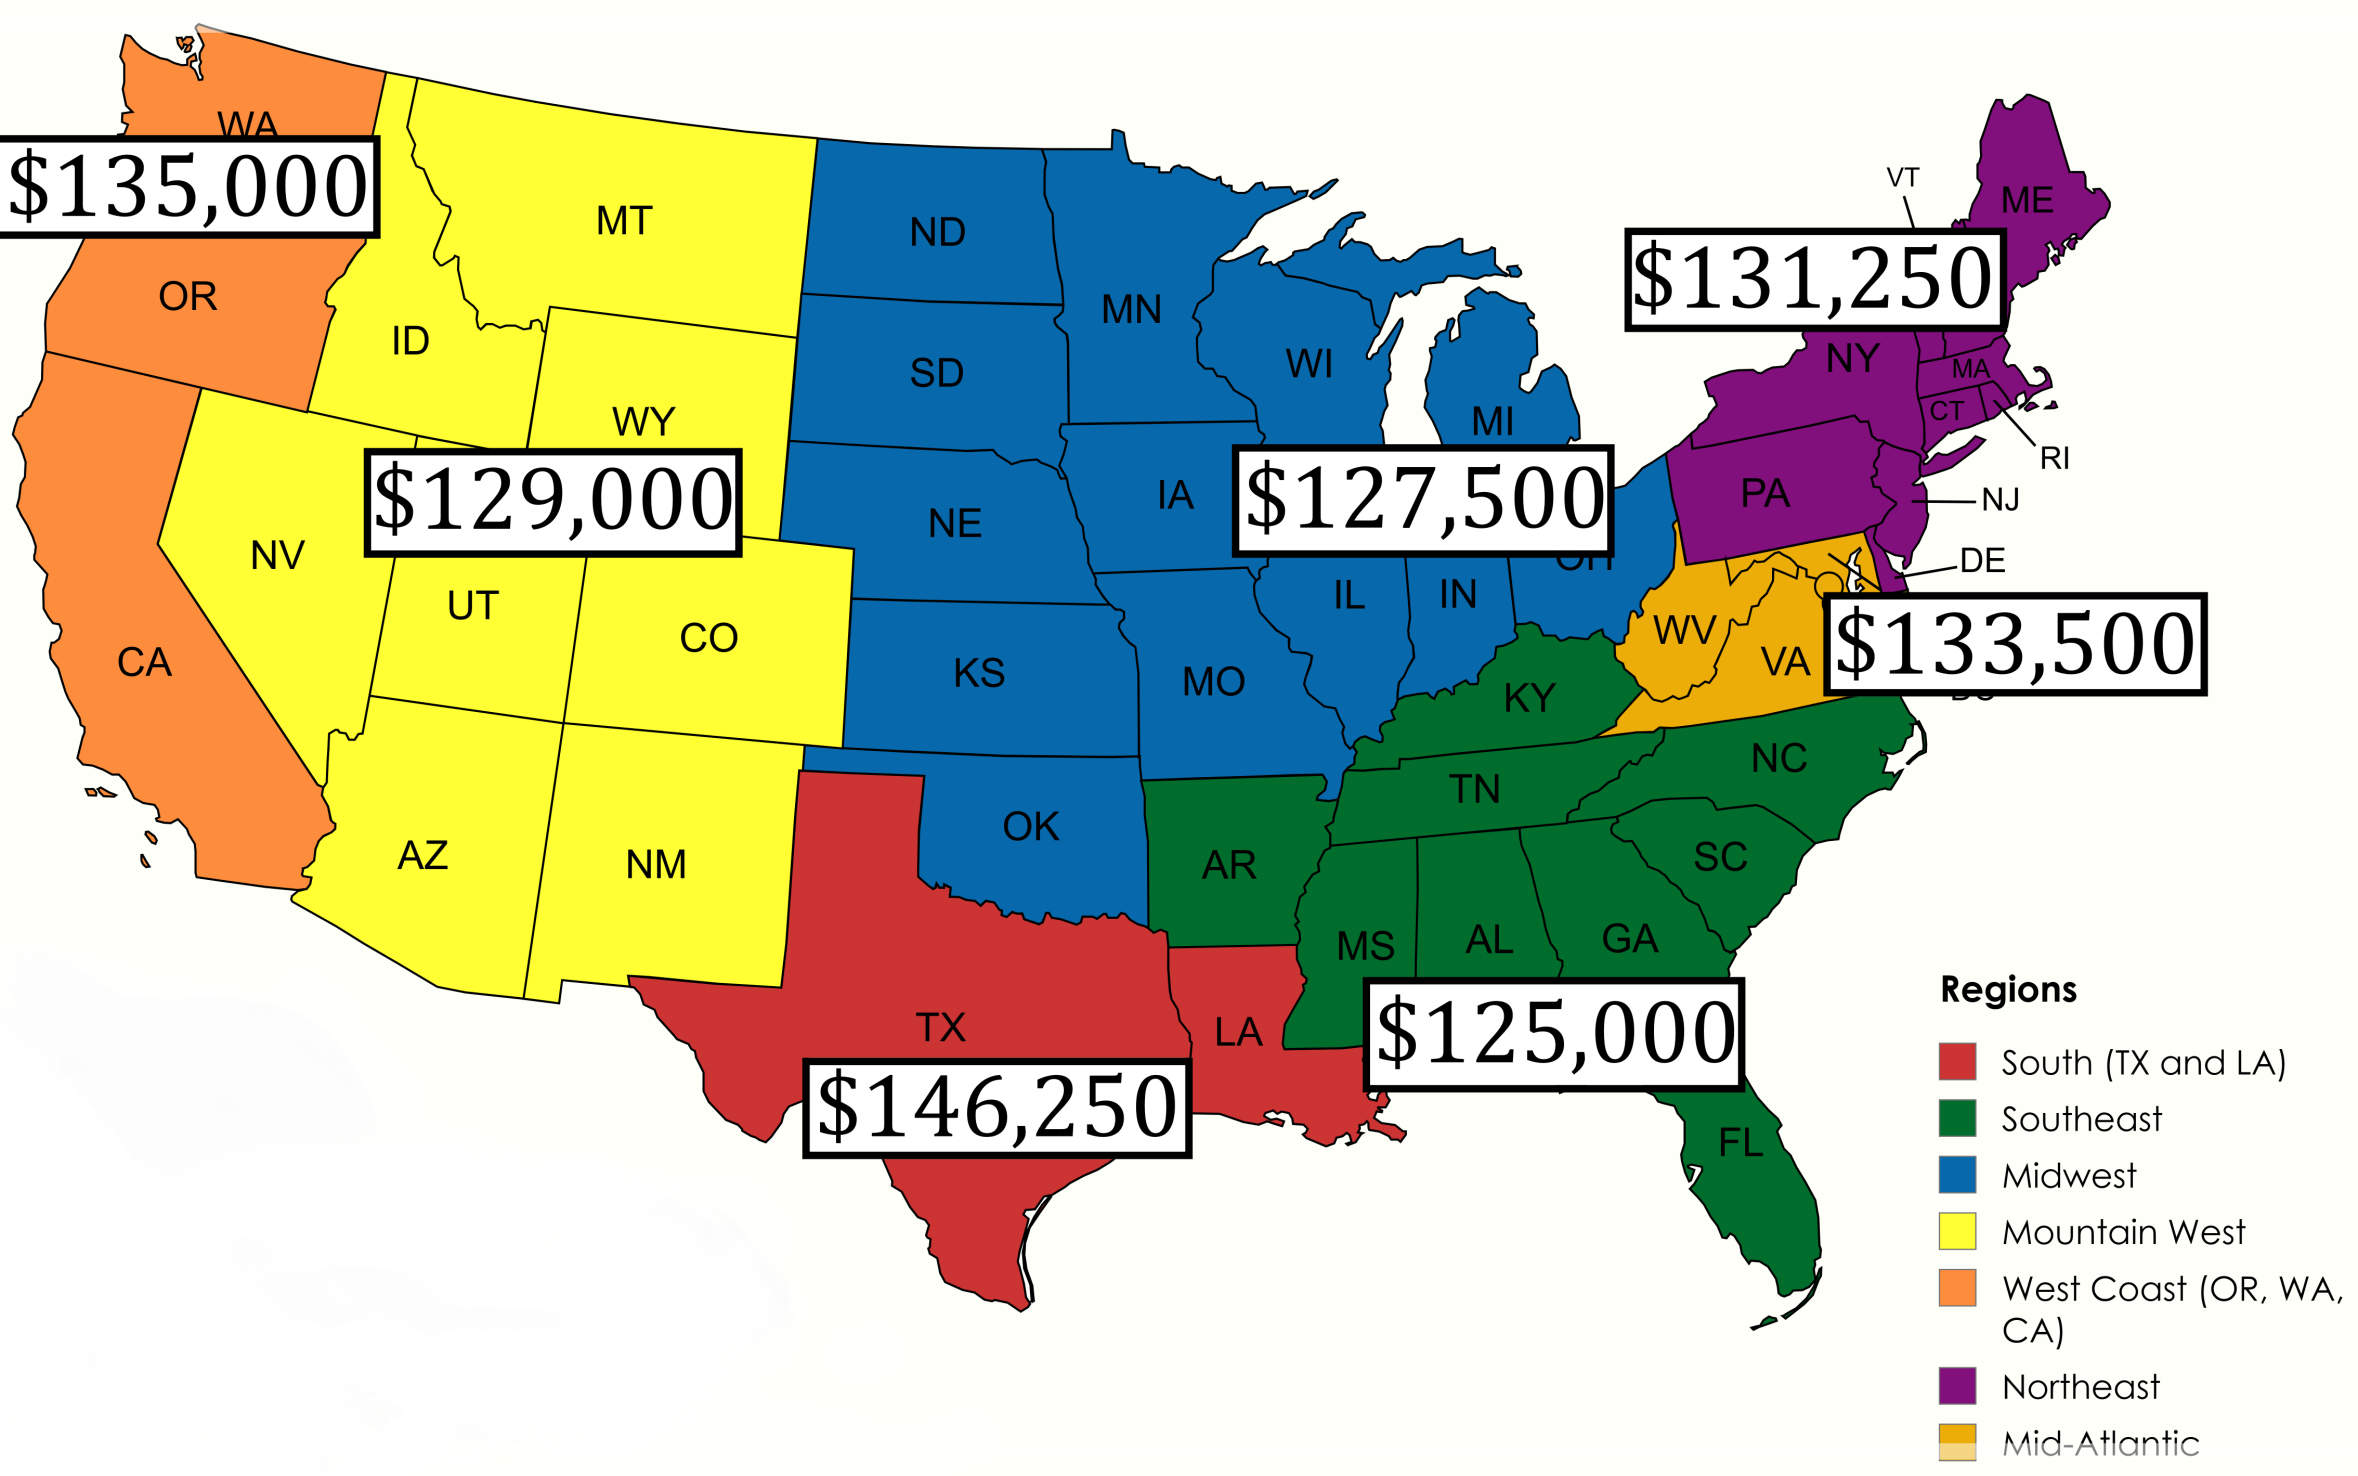
I've been asked by many to try and get more granular with this analysis and I would love to...but in order to break this down by state even, I would need more data points than I have. This is a generalized look at the country as a whole - it is meant to convey broad trends, and I've included the 2025 numbers side-by-side with the 2026 numbers so you can see the year-over-year trends.
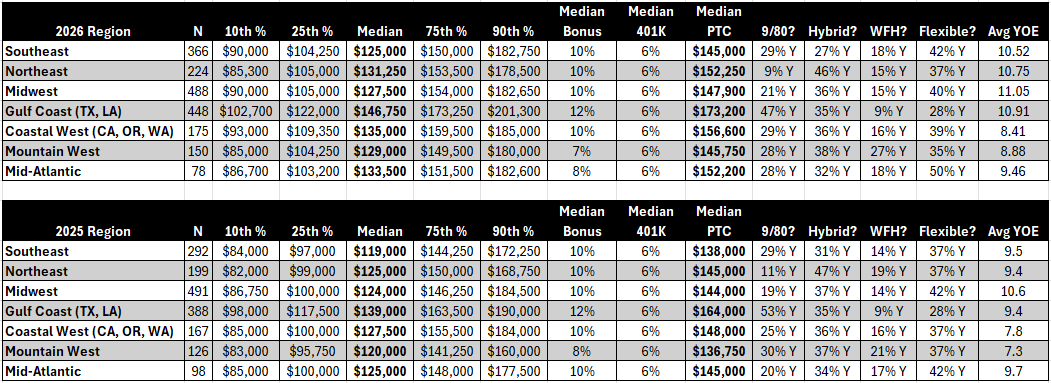
Commentary:
I mentioned it earlier, but the dataset is definitely aging, so that could be accounting for some of the differences. I love seeing the side-by-side last year just to see how the dataset moves, not only on things like salary, but also for schedule differences and even how the demographic changes.
An important thing to keep in mind with this data is the obvious differences in cost-of-living. A job in California paying $125,000 is not equivalent to a job paying that same amount in Tennessee. For one, the person in CA is paying state income tax whereas the person in Tennessee is not...and obviously the housing costs between those two locations will also be very different. This chart will be especially important for those who might be considering a job change to another state or region of the country. If I were to rank the compensation-competitiveness (at the median) of these regions based on relative cost-of-living, I would rank them as follows:
1.) Gulf Coast
2a.) Southeast
2b.) Midwest
4.) Mid-Atlantic
5.) Intermountain West
6.) Northeast
7.) Coastal West (particularly in the big cities of LA, San Francisco, and Seattle)
CHEMICAL INDUSTRY PERKS COMPARISON
I'm so excited to share this and this is where Julius AI blew me away this year. I asked it to create a dashboard where someone could select between a few variables to display customized information and this is what it came up with. I've still included the 'wall' of data as I have in past report, but this dashboard was so cool, I couldn't wait to share it. Essentially, I created a dashboard where you can change the variables according to what you want to see. The variables are "Region", "Job Type", "Industry", "IC or Mgr" and "Company Size". To access the dashboard, click here. Sample-size warnings from other dashboards apply here as well.
**There is an important data security caveat here (and this applies to all dashboards I have shared in this report). The file that I uploaded into Julius for this analysis (and which serves as the backbone of all these dashboards) was utterly and completely anonymized. All information was removed that could identify any one specific data point. The only information added to the file was state information (for region indexing), anonymized job type, bucketed industry information, and anonymized (rounded to the nearest $250) base salary data. For example, if someone responded to the survey and reported that their salary was $97,774, that number, in the dataset was changed to $97,750. No identifying information, company information, zip code, job title, or even city data was included in that dataset.**
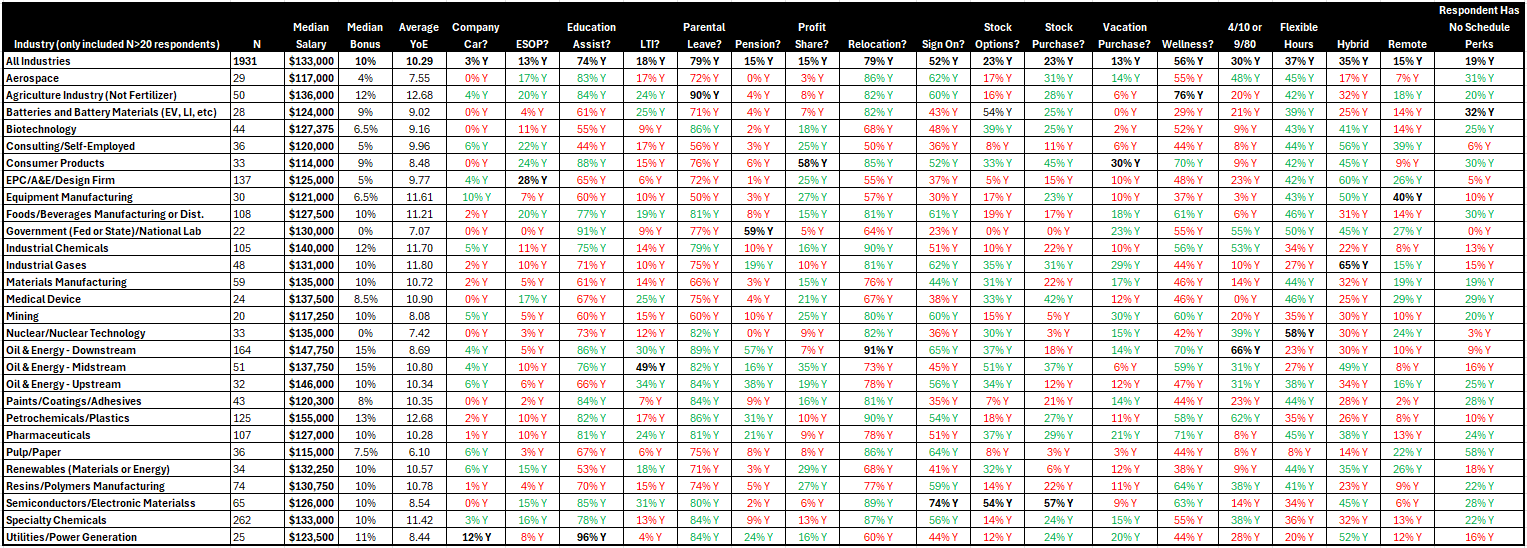
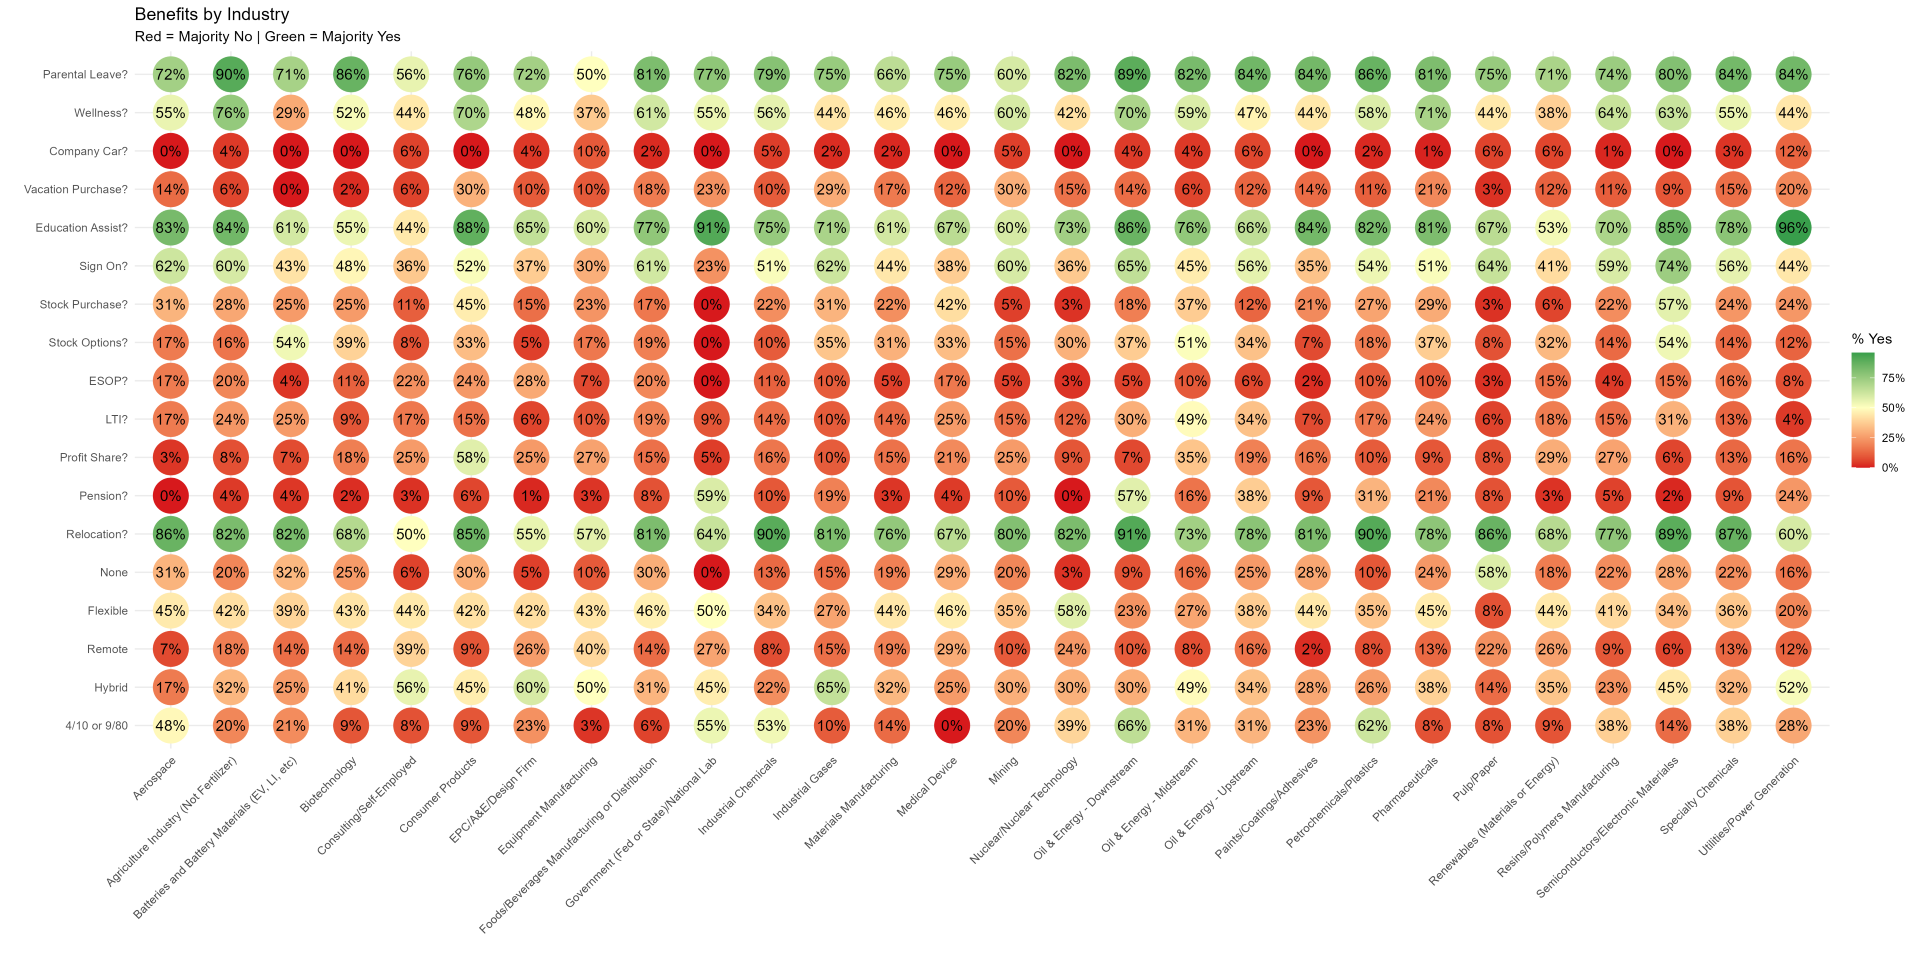
If you haven't seen the table below before - I present the data here in two ways - first I give you the percentage of respondents that responded, "Yes, my company offers _____." Second, I color coded the numbers. Green means that sub-industry is above the overall industry average in that category and red means that they are below the overall industry average (the overall averages across all respondents is at the top). Within each category, I highlight the above and below average outliers. The 'sample size alert' applies here for several of the industry categories. I didn't even include industries that had less than 20 respondents and I would say that less than 30 should be a potential flag. The chart below the 'wall' is the same data, just presented in a different way.
Commentary:
First, I appreciate everyone who has given feedback on this section - it has helped me come up with an even better list of sub-industries (there might be too many now) and has given me ideas of what to ask about. Again, this chart is not meant to be very specific, but rather to provide some broad-strokes information on differences between industries. Here are some differences between this year's information and last year's that I'd like to highlight:
- Median Base Salary across the industry is up ~4-5% from year over year ($133K this year, $127.5K last year), though unlike last year, where the average years' of experience stayed the same year-to-year, this year, the average YOE went from around 8 to just over 10. I have to think about what this means. For example - my thought is: can the increase this survey reports for 2025 purely because of a slightly more experienced dataset or did the industry, as a whole, really see at 4-5% increase?
- Work from home - Work-from-home went from 29% in Dec 2023 to 14% in Dec 2024 and now is pretty close to that level (15%). All other alternative schedules (9/80, Hybrid, Flex Hours) stayed about the same from last year's report.
- Education Reimbursement: 52% of respondents reported that their employer offered this last year, this year it was 74%!
- Sign-On Bonus for New Hires: last year this went up, from 40% to almost 60% and then from Dec 2024 to Dec 2025, it went down to 52%. Not a huge decline, but certainly mirrors the cooling job market we saw in 2025.
The thing I added this year was asking people about how much parental leave they get. This data varied WILDLY. Last year 80% of the respondents said their company offers this perk, this year it was pretty much the same at 79%. If I had to make an attempt at summarizing the kind of detail I got on this, it would be that most people get between 4 and 12 weeks of parental leave. Some companies distinguish between mothers and fathers, others don't.
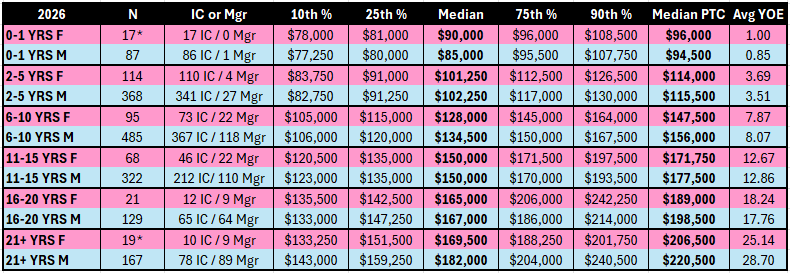
COMPARISON BETWEEN MALE AND FEMALE ENGINEERS
Thank you for answering a gender question this year - it saved a lot of time. The results here are pretty straight-forward in suggesting that the gender pay gap is real, but not super pronounced. There is one artifact to point out and that is in the dataset for 21+ years of experience. The Female respondents had about 3.5 years less experience, on average, than the Male respondents and I think that accounts for much of the difference we see with those two rows of data.
Commentary:
I don't trust the validity of the data in the 21+ experience category (or the 0-1 F and 16-20 F categories either for that matter), the sample size for Female engineers there is too small, so my commentary will be on the rest of the dataset.
What's interesting to me is what's outside the median. For the 75th and 90th percentiles, by and large the data shows that women are paid higher than men, whereas at the median and below, it's roughly the same, within a few percentage points. I like how tight the Avg YOE tracks together (outside of the datapoints for 21+ YOE). Those make for very "apple-to-apples" comparisons.
In 2023, the dataset was about 16% females, in 2024, it was just north of 17%, in 2025 it was just over 16% and this year it was right around 18%. I made a direct effort to reach female engineers this year - I contacted some folks at SWE (Society of Women Engineers) and also posted on the Women in Engineering subreddit. Having said, I think we can conclude, fairly definitively at this point, that women make up about 17-20% of the population of chemical engineers in the US. I'm very curious to maybe one day be able to see how ChemE compares to other engineering disciplines in terms of compensation by gender.
CHEMICAL ENGINEER SALARY TREND DATA:
To me, this is the most exciting aspect of doing these yearly compensation reports - to see trend data over time.
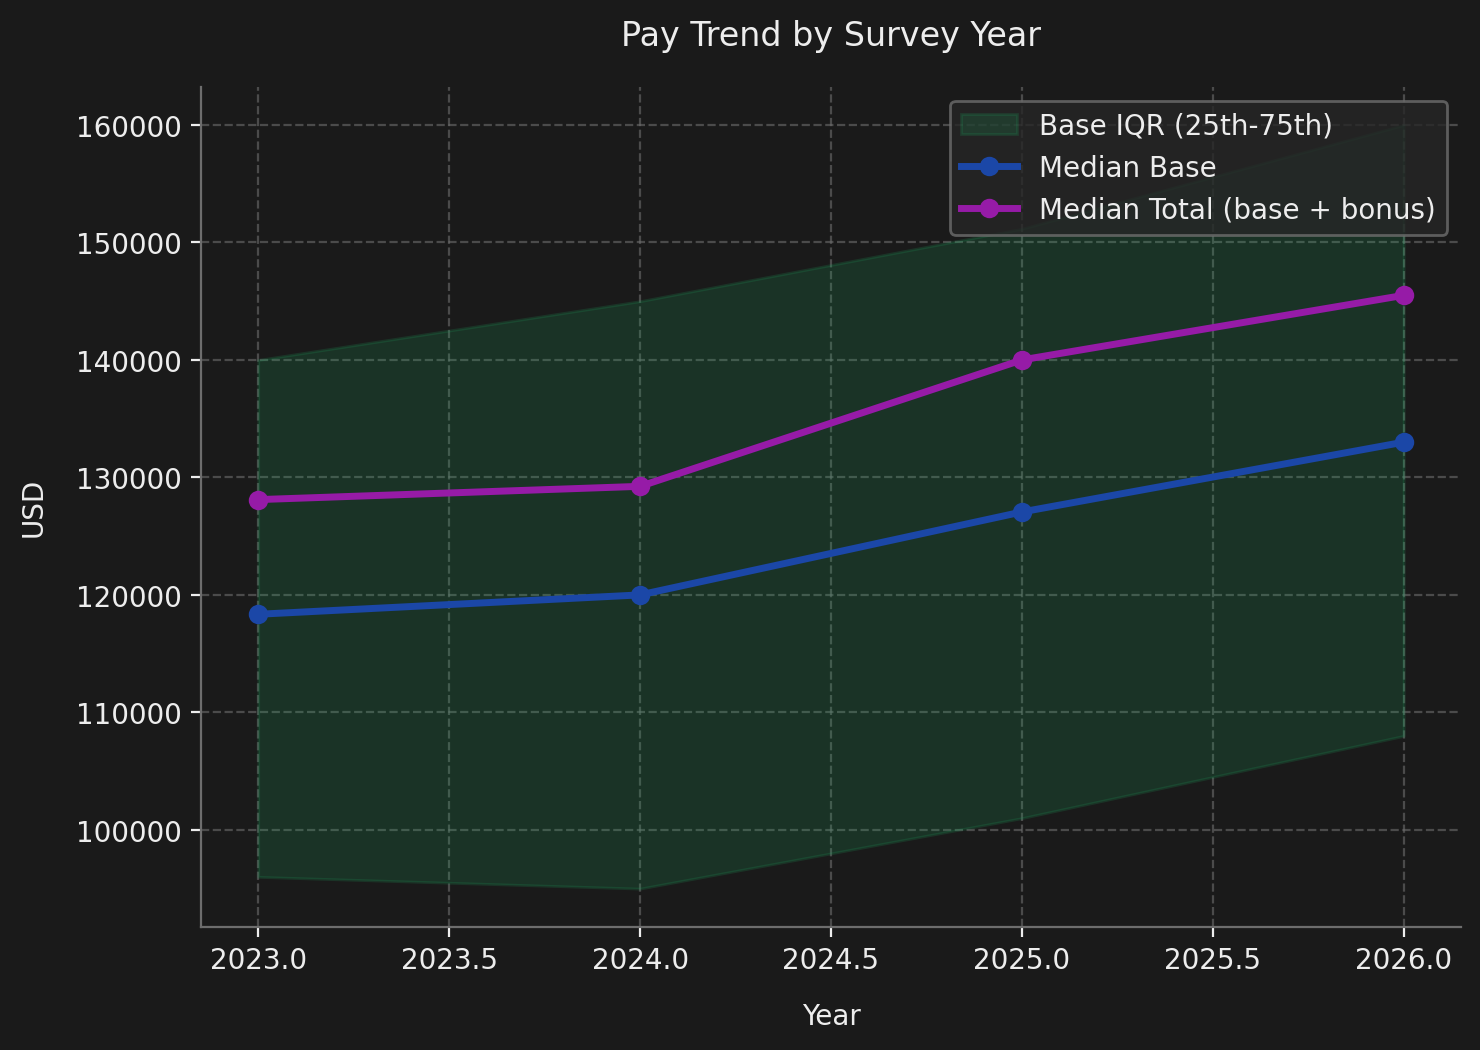
I don't really have a lot of commentary here, the data speaks for itself. I also created a dashboard for this data - which can be accessed here. The new "Median PTC" (Potential Total Comp) figure is interesting to me - it kind of mutes the gains from 2025 to 2026.
Discussion/General Comments:
I continue to be grateful to this community for your help in putting this together every year. Without your data, I would have nothing to report and many of you continue to contribute your data year after year. THANK YOU! I think at this point the report itself has reached a level of 'homeostasis' - at the current level of data that I have, the ability to continue increasing the level of insight diminishes, but I hope to continue to grow the dataset in future years and to pursue further levels of insight. Having said that - I'm so excited about what AI can help with and the dashboards that I've added this year are a big step in that direction.
Someone asked if I read all of the comments that people leave on the survey and YES, I absolutely read them, and that is actually a huge reason why I've added stuff to the survey every year. Comments, suggestions and critique from this community has 100% made this report better every year.
Last year I had Julius AI run a regression analysis on the financial benefit, in terms of base salary, on a single year of experience. It calculated that at the median, a year of experience is worth approximately $3,250. This year, that number stayed fairly static, the precise amount of $3,378. However, it added some additional insight this year by estimating the slope and gave me this: "from years 0-10, an extra year of experience it worth roughly $6.2K - $6.6K in base salary, from 10-20 years, it drops to about $2.7K - $4.0K and beyond 20 years it flattens further."
I acknowledge that there were some things related to benefits satisfaction, company values and team dynamics in the survey, that I didn't address in this report. I need some more time to think about what to make of that data. Having said that - here is one final dashboard that summarizes the data gathered and also allows you to see how the data changes based on a few different parameters. If you follow me on LinkedIn, I regularly share insights there, both insights from the data that I don't put in the report as well as general industry insights. I will be putting some thought on what to do with the data from the questions at the end of the survey share those insights on LinkedIn.
What's Coming in 2026:
I recently published by ChemE Quarterly Newsletter where I read all of the 'expert' opinions on the Chemical Industry Outlook for 2026 and summarized them. Basically - 2025 was 'meh' and 2026 is likely to be mostly flat with some improvement starting maybe towards the middle of 2026 and beyond. The big snafu in everything in 2025 was tariffs...I think many people saw it coming but didn't quite foresee the disruptive nature of an ever-changing tariff landscape. The ongoing drag on the the industry, both nationally and globally, is oversupply - but that's also related to tariffs.
The full impacts of the OBBB (One Big Beautiful Bill) will start to be felt in 2026 and as I've talked about in earlier editions of my Newsletter, there are some potentially positive aspects of that bill from a business standpoint that could unlock quite a bit of capital.
In terms of dynamics that are affecting the job market - not much has changed year-over-year. High housing prices and higher interest rates continue to make relocation a challenge for people who currently own homes. This means that the pool of 'passive' talent for any role remains small. There was a lot of reorganization and restructure activity in early-to-mid 2025 that saw a lot of middle-management roles cut and those are the folks I see having the hardest time finding new roles. The market for individual-contributor level technical talent still seems to be there, but companies are definitely more content to wait for 'the right fit' than they were say 2-3 years ago. "The Right Fit" tends to mean a more experienced engineer...I see fewer and fewer companies having to re-do searches are more junior levels in order to fill an opening.
M&A activity seems to be picking up again and it remains to be seen what affect that will have on the industry and the job market. Anecdotally it was a very quiet Q4 and the beginning of 2026 seems relatively quiet (from a hiring standpoint) so far as well.
Summary of Dashboards
Here is a list of all of the dashboards contained in this report, for ease of access:
Compensation Benchmark Explorer
Author:
Adam Krueger is a technical recruiter and President of Sun Recruiting. He and Sun Recruiting specialize in the chemical processing industry and they bring decades of expertise in placing chemical engineers with chemical processing companies all over the United States.
Chemical Engineer Salary Negotiation Service
Do you have an offer or are you approaching a review/promotion situation? Do you want to arm yourself with data? I have a fee-based service for that – I guarantee results (for new offers) and will work with you to maximize your offer; click the link for more information. In the past year, I've helped over 20 people by arming them with their own custom compensation report (tailored to their specific situation) and the success rate so far is over 90%.
Website: https://www.sunrecruiting.com LinkedIn: https://www.linkedin.com/in/adamrkrueger Email: adam@sunrecruiting.com